Collection of models that illustrate model use and test models
Information
This package contains examples models for demand response clients.
Extends from Modelica.Icons.ExamplesPackage (Icon for packages containing runnable examples).
Package Content
| Name |
Description |
 ClientLBNL90 ClientLBNL90
|
Demand response client with input data from building 90 at LBNL |
Demand response client with input data from building 90 at LBNL
Information
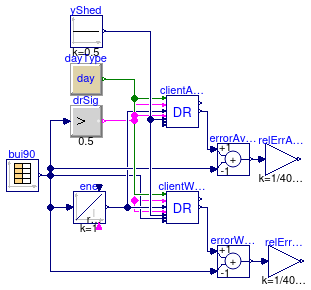
Model that demonstrates the demand response client,
using as an input for the actual electrical consumption simulated
data from building 90 at LBNL.
Output of the data reader are the outdoor dry-bulb temperature,
the total electrical consumption,
and a signal that indicates whether load shedding is required.
Output of the demand response blocks are the predicted power consumption.
If the input signal shed is true,
then the predicted load is reduced by the amount of power that is shed,
as received from the input signal yShed.
Extends from Modelica.Icons.Example (Icon for runnable examples).
Parameters
| Type | Name | Default | Description |
|---|
| Integer | nSam | 24*4 | Number of samples in a day |
Modelica definition
model ClientLBNL90
extends Modelica.Icons.Example;
parameter Integer nSam = 24*4 ;
Client clientAverage(
nSam=nSam,
predictionModel=Buildings.Controls.Predictors.Types.PredictionModel.Average)
;
Sources.DayType dayType ;
Modelica.Blocks.Sources.CombiTimeTable bui90(
tableOnFile=true,
tableName="b90",
smoothness=Modelica.Blocks.Types.Smoothness.ConstantSegments,
extrapolation=Modelica.Blocks.Types.Extrapolation.Periodic,
fileName=
Modelica.Utilities.Files.loadResource(
"modelica://Buildings/Resources/Data/Controls/DemandResponse/Examples/B90_DR_Data.mos"),
columns={2,3,4}) ;
Modelica.Blocks.Logical.GreaterThreshold drSig(threshold=0.5)
;
Modelica.Blocks.Math.Add errorAverage(k2=-1)
;
Client clientWeather(
nSam=nSam,
predictionModel=Buildings.Controls.Predictors.Types.PredictionModel.WeatherRegression)
;
Modelica.Blocks.Math.Add errorWeather(k2=-1)
;
Modelica.Blocks.Math.Gain relErrAverage(k=1/400000)
;
Modelica.Blocks.Math.Gain relErrWeather(k=1/400000)
;
Modelica.Blocks.Continuous.Integrator ene(u(unit="W"))
;
Modelica.Blocks.Sources.Constant yShed(k=0.5)
;
equation
connect(clientAverage.isEventDay, clientAverage.shed);
connect(drSig.u, bui90.y[3]);
connect(drSig.y, clientAverage.shed);
connect(clientAverage.PPre, errorAverage.u1);
connect(clientWeather.isEventDay, clientWeather.shed);
connect(drSig.y, clientWeather.shed);
connect(clientWeather.PPre, errorWeather.u1);
connect(clientWeather.TOut, bui90.y[1]);
connect(relErrAverage.u, errorAverage.y);
connect(relErrWeather.u, errorWeather.y);
connect(ene.u, bui90.y[2]);
connect(ene.y, clientWeather.ECon);
connect(ene.y, clientAverage.ECon);
connect(errorWeather.u2, bui90.y[2]);
connect(errorAverage.u2, bui90.y[2]);
connect(dayType.y, clientAverage.typeOfDay);
connect(dayType.y, clientWeather.typeOfDay);
connect(yShed.y, clientAverage.yShed);
connect(clientWeather.yShed, yShed.y);
end ClientLBNL90;
 Buildings.Controls.DemandResponse.Examples.ClientLBNL90