Buildings.Electrical.AC.ThreePhasesUnbalanced.Sources.Examples
Package with example models
Information
This package contains examples for the use of models that can be found in Buildings.Electrical.AC.ThreePhasesUnbalanced.Sources.
Extends from Modelica.Icons.ExamplesPackage (Icon for packages containing runnable examples).
Package Content
| Name | Description |
|---|---|
| This example illustrates how using a fixed voltage source | |
| This example illustrates how to use PV panel models | |
| This example illustrates how to use PV panel models with neutral cable | |
| Example for the WindTurbine AC model | |
| Example for the WindTurbine AC model with neutral cable |
 Buildings.Electrical.AC.ThreePhasesUnbalanced.Sources.Examples.FixedVoltageSource
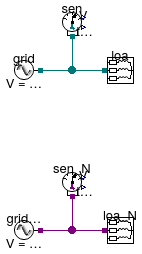
This example illustrates how using a fixed voltage source
Information
This example shows how to use a fixed voltage generator model.
Extends from Modelica.Icons.Example (Icon for runnable examples).
Modelica definition
Buildings.Electrical.AC.ThreePhasesUnbalanced.Sources.Examples.PVPanels
This example illustrates how to use PV panel models
Information
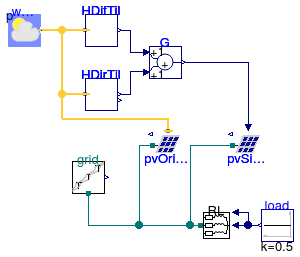
This example shows how to use a simple PV model without orientation as well as a PV model with orientation. The power produced by the PV is partially consumed by the load, and the remaining part is fed into the grid.
The PV produces different amounts of power on each phase according to the fractions
specified by the vector areaFraction={0.5,0.3,0.2}. In this example, 50%
of the power generation is on phase 1, 30% on phase 2 and 20% on phase 3.
Extends from Modelica.Icons.Example (Icon for runnable examples).
Modelica definition
Buildings.Electrical.AC.ThreePhasesUnbalanced.Sources.Examples.PVPanels_N
This example illustrates how to use PV panel models with neutral cable
Information
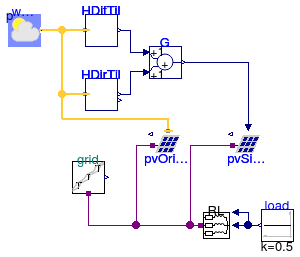
This example shows how to use a simple PV model with neutral cable connection and without orientation as well as a PV model with orientation. The power produced by the PV is partially consumed by the load, and the remaining part is fed into the grid.
The PV produces different amounts of power on each phase according to the fractions
specified by the vector areaFraction={0.4,0.0,0.6}. In this example, 40%
of the power generation is on phase 1, 0% on phase 2 (disconnected) and 60% on phase 3.
Extends from Modelica.Icons.Example (Icon for runnable examples).
Modelica definition
Buildings.Electrical.AC.ThreePhasesUnbalanced.Sources.Examples.WindTurbine
Example for the WindTurbine AC model
Information
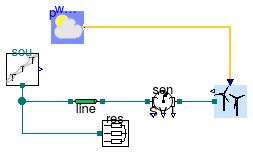
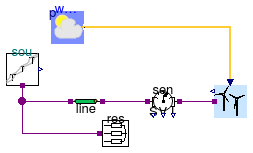
This model illustrates the use of the wind turbine model, which is connected to a AC voltage source and a resistive load. This voltage source can represent the grid to which the circuit is connected. Wind data for San Francisco, CA, are used. The turbine cut-in wind speed is 3.5 m/s, and hence it is off in the first day when the wind speed is low.
The wind turbines produce different amounts of power on each phase according to the fractions
specified by the vector scaleFraction={0.5,0.25,0.25}. In this example, 50%
of the power generation is on phase 1, 30% on phase 2 and 20% on phase 3.
As expected the phase with the higher power production has the higher voltage deviation
from the nominal condition.
Extends from Modelica.Icons.Example (Icon for runnable examples).
Connectors
| Type | Name | Description |
|---|---|---|
| Bus | weaBus | Weather bus |
Modelica definition
Buildings.Electrical.AC.ThreePhasesUnbalanced.Sources.Examples.WindTurbine_N
Example for the WindTurbine AC model with neutral cable
Information
This model illustrates the use of the wind turbine model with neutral cable, which is connected to a AC voltage source and a resistive load. This voltage source can represent the grid to which the circuit is connected. Wind data for San Francisco, CA, are used. The turbine cut-in wind speed is 3.5 m/s, and hence it is off in the first day when the wind speed is low.
The wind turbines produce different amounts of power on each phase according to the fractions
specified by the vector scaleFraction={0.4,0.0,0.6}. In this example, 40%
of the power generation is on phase 1, 0% on phase 2 (disconnected) and 60% on phase 3.
As expected the phase with the higher power production has the higher voltage deviation
from the nominal condition.
Extends from Modelica.Icons.Example (Icon for runnable examples).
Connectors
| Type | Name | Description |
|---|---|---|
| Bus | weaBus | Weather bus |