Reading output files, plotting results and reporting simulation output
- This module contains the classes
Reader that can be used to read
*.matfiles that have been generated by Dymola,Reporter that can be used to report to the standard output and standard error streams, and
Plotter that contains method to plot results.
File reader
- class buildingspy.io.outputfile.Reader(fileName, simulator)
Open the file
fileNameand parse its content.- Parameters
fileName – The name of the file.
simulator – The file format. Currently, the only supported value is
dymola.
This class reads
*.matfiles that were generated by Dymola or OpenModelica.- integral(varName)
Get the integral of the data series.
- Parameters
varName – The name of the variable.
- Returns
The integral of
varName.
This function returns \(\int_{t_0}^{t_1} x(s) \, ds\), where \(t_0\) is the start time and \(t_1\) the final time of the data series \(x(\cdot)\), and \(x(\cdot)\) are the data values of the variable
varName.- Usage: Type
>>> import os
>>> from buildingspy.io.outputfile import Reader
>>> resultFile = os.path.join("buildingspy", "examples", "dymola", "PlotDemo.mat")
>>> r=Reader(resultFile, "dymola")
>>> r.integral('preHea.port.Q_flow')
-21.589191160164773
- max(varName)
Get the maximum of the data series.
- Parameters
varName – The name of the variable.
- Returns
The maximum value of
varName.
This function returns \(\max \{x_k\}_{k=0}^{N-1}\), where \(\{x_k\}_{k=0}^{N-1}\) are the values of the variable
varName.- Usage: Type
>>> import os
>>> from buildingspy.io.outputfile import Reader
>>> resultFile = os.path.join("buildingspy", "examples", "dymola", "PlotDemo.mat")
>>> r=Reader(resultFile, "dymola")
>>> r.max('preHea.port.Q_flow')
-11.284342
- mean(varName)
Get the mean of the data series.
- Parameters
varName – The name of the variable.
- Returns
The mean value of
varName.
This function returns
\[\frac{1}{t_1-t_0} \, \int_{t_0}^{t_1} x(s) \, ds,\]where \(t_0\) is the start time and \(t_1\) the final time of the data series \(x(\cdot)\), and \(x(\cdot)\) are the data values of the variable
varName.- Usage: Type
>>> import os
>>> from buildingspy.io.outputfile import Reader
>>> resultFile = os.path.join("buildingspy", "examples", "dymola", "PlotDemo.mat")
>>> r=Reader(resultFile, "dymola")
>>> r.mean('preHea.port.Q_flow')
-21.589191160164773
- min(varName)
Get the minimum of the data series.
- Parameters
varName – The name of the variable.
- Returns
The minimum value of
varName.
This function returns \(\min \{x_k\}_{k=0}^{N-1}\), where \(\{x_k\}_{k=0}^{N-1}\) are the values of the variable
varName- Usage: Type
>>> import os
>>> from buildingspy.io.outputfile import Reader
>>> resultFile = os.path.join("buildingspy", "examples", "dymola", "PlotDemo.mat")
>>> r=Reader(resultFile, "dymola")
>>> r.min('preHea.port.Q_flow')
-50.0
- values(varName)
Get the time and data series.
- Parameters
varName – The name of the variable.
- Returns
An array where the first column is time and the second column is the data series.
- Usage: Type
>>> import os
>>> from buildingspy.io.outputfile import Reader
>>> resultFile = os.path.join("buildingspy", "examples", "dymola", "PlotDemo.mat")
>>> r=Reader(resultFile, "dymola")
>>> (time, heatFlow) = r.values('preHea.port.Q_flow')
- varNames(pattern=None)
- Pattern
A regular expression that will be used to filter the variable names.
Scan through all variable names and return the variables for which
pattern, as a regular expression, produces a match. Ifpatternis unspecified, all variable names are returned.This method searches the variable names using the
searchfunction from Python’s re module.See also https://docs.python.org/2/howto/regex.html#regex-howto.
Usage: Type
>>> import os
>>> from buildingspy.io.outputfile import Reader
>>> resultFile = os.path.join("buildingspy", "examples", "dymola", "PlotDemo.mat")
>>> r=Reader(resultFile, "dymola")
>>> # Return a list with all variable names
>>> r.varNames()
['PID.Dzero.k', 'PID.Dzero.y', 'PID.I.der(y)', 'PID.I.initType', ...]
>>> # Return ['const.k', 'const.y']
>>> r.varNames('const')
['const.k', 'const.y']
>>> # Returns all variables whose last character is u
>>> r.varNames('u$')
['PID.P.u', 'PID.gainPID.u', 'PID.limiter.u', 'gain.u', 'PID.I.u', 'PID.gainTrack.u']
Plotter
- class buildingspy.io.postprocess.Plotter
This class contains static methods that can be used to create plots. For an example of a simple plot, see also the example in
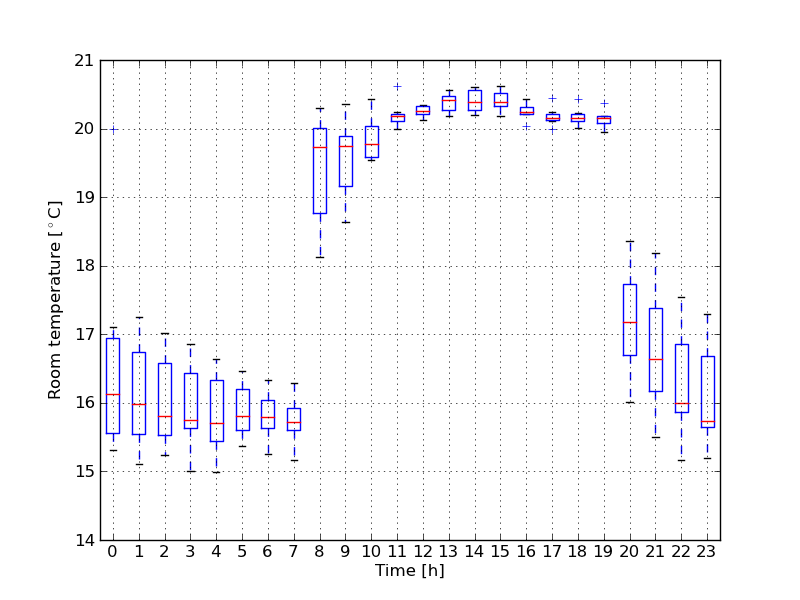
buildingspy.examples.dymola.- static boxplot(t, y, increment=3600, nIncrement=24, notch=0, sym='b+', vert=1, whis=1.5, positions=None, widths=None, patch_artist=False, bootstrap=None)
Create a boxplot of time data.
- Parameters
t – The support points in time as received from the Reader.
y – The function values at
tas received from the Reader.increment – The time increment that is used in the plot
nIncrement – The number of increments before the data are wrapped.
- Returns
This method returns a matplotlib.pyplot object that can be further processed, such as to label its axis.
All other arguments are as explained at matplotlib’s boxplot documentation.
The parameter
incrementis used to set the support points in time at which the statistics is made. The parameternIncrementis used to determine how many increments will be made. For example,for hourly statistics, use the default, which is
increment=3600, nIncrement=24, andfor statistics every five minutes over one hour, use
increment=5*60, nIncrement=12.
Usage: Type
>>> import os
>>> import matplotlib
>>> matplotlib.use('Agg')
>>> import matplotlib.pyplot as plt
>>>
>>> from buildingspy.io.outputfile import Reader
>>> from buildingspy.io.postprocess import Plotter
>>>
>>> # Read data
>>> resultFile = os.path.join("buildingspy", "examples", "dymola", "TwoRoomsWithStorage.mat")
>>> r=Reader(resultFile, "dymola")
>>> (t, y) = r.values('roo1.air.vol.T')
>>>
>>> # Create basic plot
>>> plt=Plotter.boxplot(t=t, y=y-273.15, increment=3600, nIncrement=24)
>>>
>>> # Decorate, save and show the plot
>>> plt.xlabel('Time [h]')
Text(0.5, 0, 'Time [h]')
>>> plt.ylabel(u'Room temperature [°C]')
Text(0, 0.5, 'Room temperature [°C]')
>>> plt.grid()
>>> plt.savefig("roomTemperatures.png")
>>> plt.show()
to create a plot as the one shown below.
- static convertToPeriodic(tPeriod, t, y)
Convert the data series
(t, y)such thattis periodic with periodicitytPeriod.- Parameters
tPeriod – Period to which
tneeds to be converted.t – Equally spaced, increasing vector of time, with
t[0]=0.y – Function values at support points
t.
- Returns
Vectors
(np.array(tP, y))wheretPis periodic with periodtPeriod.
The vector
tmust start at zero, be equally spaced and increasing. For example,tcould be>>> import numpy as np >>> t=np.linspace(0, 86399, 86400)
if
tspans one year and the data are hourly (hence,t[0]=0andt[-1]=86399).
- static interpolate(tSup, t, y)
Interpolate the values of
(t,y)at the support pointstSup.- Parameters
tSup – Support points.
t – Time stamps of variables
y.y – Function values at time stamps
t.
- Returns
Interpolated values of
varNameattSup
Usage: Type
>>> import os
>>> import numpy as np
>>> import matplotlib
>>> matplotlib.use('Agg')
>>> import matplotlib.pyplot as plt
>>>
>>> from buildingspy.io.outputfile import Reader
>>> from buildingspy.io.postprocess import Plotter
>>>
>>> resultFile = os.path.join("buildingspy", "examples", "dymola", "PlotDemo.mat")
>>> r=Reader(resultFile, "dymola")
>>> (t, y) = r.values('temSen.T')
>>> tSup=np.linspace(0, 1.0, num=50)
>>> TInt=Plotter.interpolate(tSup, t, y)
>>> plt.plot(tSup, TInt)
[<matplotlib.lines.Line2D object at ...>]
>>> plt.show()
Reporter
- class buildingspy.io.reporter.Reporter(fileName)
Class that is used to report errors.
- deleteLogFile()
Deletes the log file if it exists.
- getNumberOfErrors()
Returns the number of error messages that were written.
:return : The number of error messages that were written.
- getNumberOfWarnings()
Returns the number of warning messages that were written.
:return : The number of warning messages that were written.
- logToFile(log=True)
Function to log the standard output and standard error stream to a file.
- Parameters
log – If
True, then the standard output stream and the standard error stream will be logged to a file.
This function can be used to enable and disable writing outputs to the file ‘’fileName’’. The default setting is
True
- writeError(message)
Writes an error message.
- Parameters
message – The message to be written.
Note that this method adds a new line character at the end of the message.
- writeOutput(message)
Writes a message to the standard output.
- Parameters
message – The message to be written.
Note that this method adds a new line character at the end of the message.
- writeWarning(message)
Writes a warning message.
- Parameters
message – The message to be written.
Note that this method adds a new line character at the end of the message.